Sound Source Localization
-
Sound Intensity Probes
-
Particle Velocity Sensors
-
Sound Sources | VVS
-
Portable Measurement Devices
-
Sound Source Localization
-
Acoustic Material Testing
-
Sound Power & Source Ranking
-
End of Line testing software
-
Acoustic Testing & Analysis Software
-
Sensor Arrays
-
Preamplifiers & Frontends
-
Accessories
Sound Source Localization Solutions for Optimal Acoustic Performance
Sound source localization systems are designed to pinpoint the origin of sound in a given environment. Conventionally, these systems employ various methods such as direct sound mapping, beamforming and nearfield acoustic holography to determine the location of various sound sources. They are commonly used in a wide range of applications, including identifying and resolving noise issues, evaluating the acoustic performance of different products, and providing objective data to support subjective sound assessments. With the use of advanced techniques such as 2D acoustic imaging and 3D sound visualization, these systems can provide detailed analysis of sound sources and aid in the identification and correction of noise problems.

Noise Source Identification in Noisy Environments
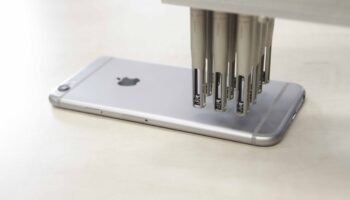
Particle velocity measurements can be used near a radiating surface to perform sound localization in environments with high background noise. Near-field measurements are less affected by surrounding sound sources and can be used to address acoustic problems in noisy environments. The vector nature of particle velocity, its intrinsic dependency on surface displacement, and sensor directivity are the main advantages of this method over sound pressure-based solutions. These capabilities make it possible to identify and quantify the noise sources, even in the most challenging testing conditions.

Low frequency sound localization
Low-frequency noise can be a challenging problem to address, as it can be difficult to detect and mitigate large wavelength sources using traditional pressure-based methods. Microflown Solutions use sensors that measure sound intensity directly, even in full 3D. These sensors have the ability to measure low-frequency noise down to 20Hz and can provide reliable quantification as well as direction information. As a result, it becomes possible to detect, visualize and quantify low-frequency noise sources, allowing for an effective resolution of low-frequency noise problems.
High Resolution Sound Mapping
Traditional sound pressure-based methods often struggle to separate closely spaced sources in complex sound fields. Microflown's particle velocity sensors, with their near-field boost, vector nature, and directional response, offer double the spatial resolution of conventional microphones. This advanced technology allows you to pinpoint key noise radiation areas, even in challenging environments and at low frequencies.
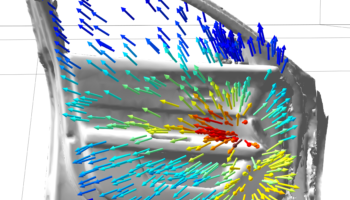
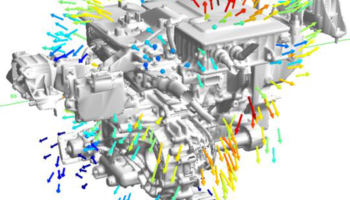
2D and 3D Visualization for Stationary and Transient Sources
Maximize your acoustic engineering projects with Microflown's advanced 2D and 3D sound source localization technology. Our cost-effective 2D solutions, such as S&P2D, offer fast and efficient in-situ source localization for troubleshooting projects. Our 3D solutions provide a more comprehensive approach to analyze complex sources and environments, enabling visualization of the amplitude and direction of the acoustic propagation. This allows for a better understanding of how sound radiates, propagates and interacts with obstacles. Whether you need a quick visualization of a stationary source or a detailed analysis for a transient problem, Microflown has the ideal sound source localization solution for your needs.

FAQ
-
Sound source localization systems provide detailed information on the location, intensity, and frequency of a sound source, which can help to identify and locate noise issues in complex machines or environments. This information can include the position of the sound source in 3D space, the sound pressure level at various locations, and the frequency spectra of the sound. Additionally, sound source localization systems can provide visual representation of the sound field through 2D or 3D acoustic imaging, allowing for easy identification of problem areas and better understanding of source interactions. This data can be used to identify the specific components or sub-systems that are causing the noise issue, and can aid in the design and implementation of noise control measures.
-
Particle velocity is the best indicator as velocity is less dependent on the test environment. Particle velocity has twice the spatial resolution of sound pressure, while sound intensity mapping has about 1.5 times better resolution than pressure. The SNR gets maximized in the vicinity of the noise source.
-
Frequency resolution is determined by the difference between each bin of the frequency vector. This depends on the parameters of the analyser, such as the FFT points and sampling frequency. To achieve 1 Hz resolution, simply use the same number of FFT points as the sampling frequency.
-
To rank the importance of different components or sub-sections of a complex device, you can break it down into multiple sections or areas and calculate the sound power for each one by multiplying the sound intensity by the area. This will give you a quantitative measure that can be directly compared.
Products