


Release Notes | VELO 2026 Autumn update
VELO 2026 AUTUMN UPDATE
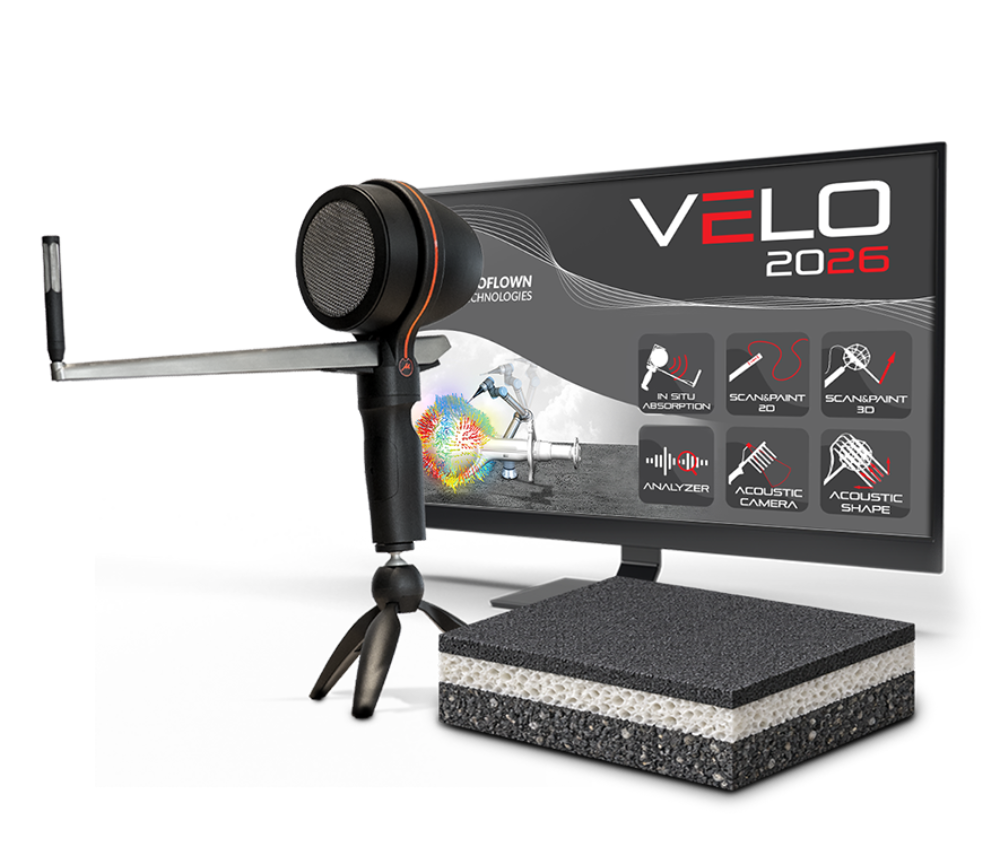
The latest VELO 2026 update expands the Microflown ecosystem with new capabilities for material characterization, sound power, acoustic analysis and automated testing. A key development is the evolution of In-Situ Absorption into the Near-Field Material Tester, combining new measurement hardware, a dedicated PU Gen 2 probe, and an expanded software solution for material characterization.
The release also introduces a new sound power calculation process in Scan&Paint 2D, phase-animation tools in Scan&Paint 3D, virtual tachometer in Acoustic Shape, psycho-acoustic calculations in Analyzer.
Near Field Material Tester
Formerly known as In-Situ Absorption, the application has evolved into the Near Field Material Tester, reflecting its broader role in acoustic material characterization.
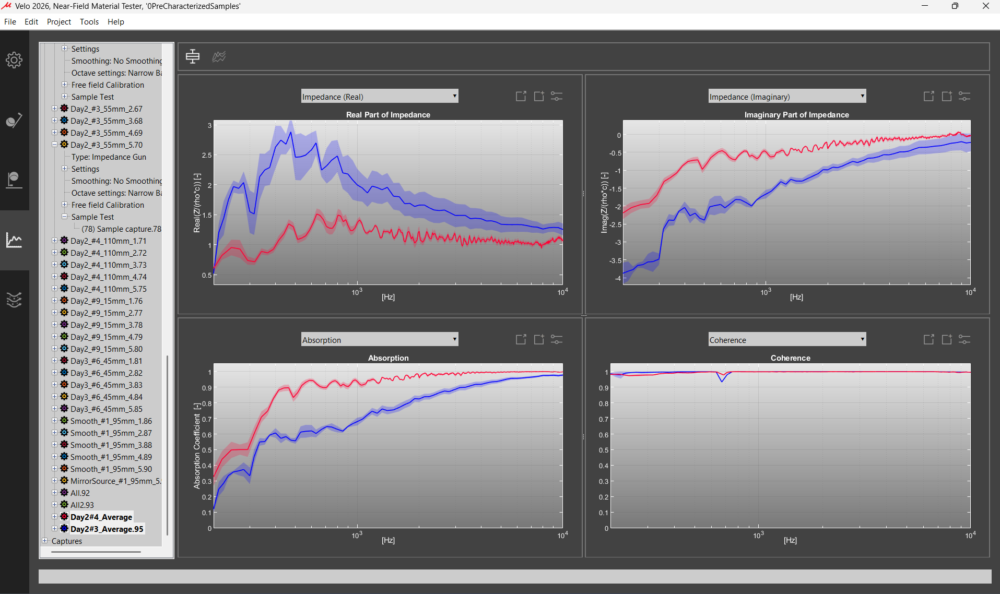
- New confidence interval visualization for extracted material properties.
- Show or hide all captures belonging to a material test for faster dataset inspection.
- Export of modelled absorption results.
- New batch settings for more efficient processing of multiple measurements.
- Import of compatible measurement data from AQCURA for further material characterization.
- Continued access to absorption, reflection coefficient, complex surface impedance and material-model results.
Standard deviation
Confidence intervals can now be displayed for datasets extracted from material measurements, providing a direct indication of temporal or spatial variability across the frequency spectrum. This allows users to evaluate the consistency of repeated measurements or measurements performed at different positions and provides additional context when interpreting the resulting material properties.
From measurement to material model
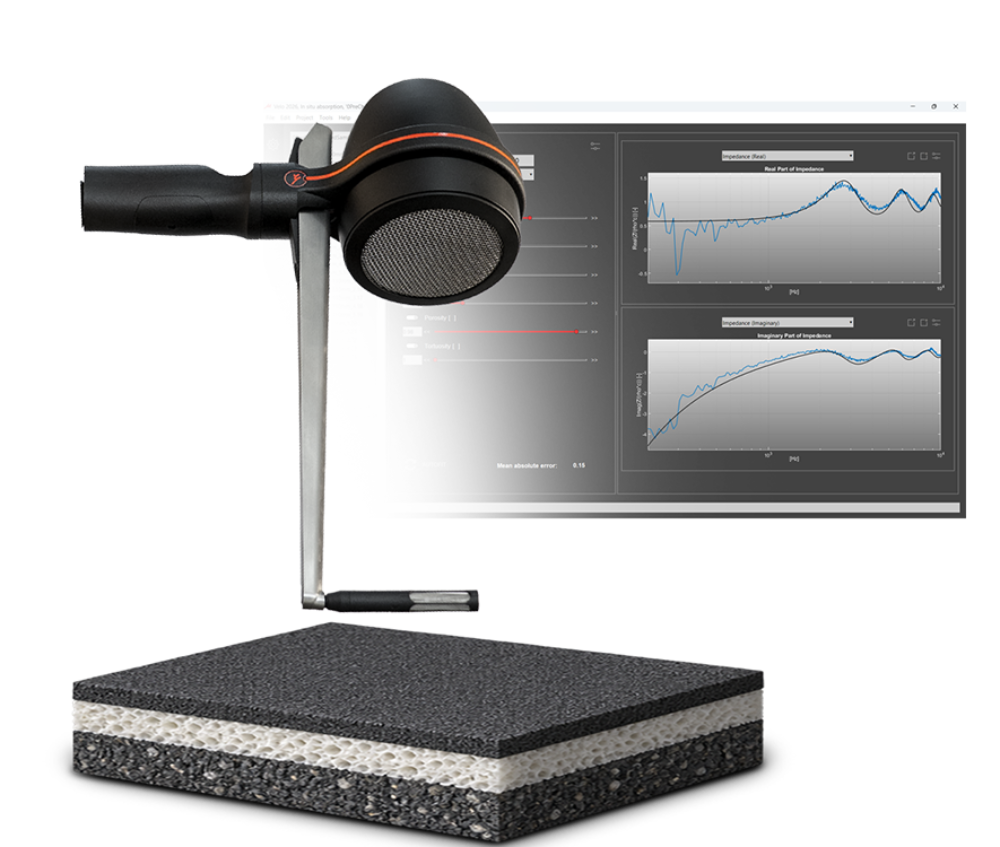
The Near Field Material Tester continues to connect direct acoustic measurements with material modelling. Measured impedance data can be used to evaluate material behavior and generate modelled responses, while the expanded export and dataset-management functionality makes it easier to compare measured and modelled results and continue the analysis outside VELO. The dedicated PI Gen 2 probe and revised measurement hardware complement these software developments with a measurement geometry specifically developed for the Near Field Material Tester.
Scan&Paint 2D
STANDARD
- New dedicated sound power process for measurements across multiple surfaces or views.
- Multiple measurement faces can now be managed within one process instead of creating a separate process for every surface.
- Automatic measurement-area calculation with direct feedback during setup.
- Combined sound power results can be calculated directly from the individual measurement surfaces.
A more efficient sound power workflow
Sound power measurements involving several sides of a machine or component can now be handled within one dedicated process.
Users can create and switch between individual measurement faces while keeping them part of the same sound power calculation. Automatic area calculation provides immediate feedback during setup, while the individual measurements can be combined into the total sound power result.
This significantly reduces the amount of process management required for multi-surface sound power measurements and creates a more structured workflow from acquisition to final result.
Scan&Paint 3D
PRO
- Measurement planes can now be copied between processes, reducing repeated setup when working with similar measurement configurations.
- Improved user experience for robotic scanning workflows.
- Improved persistent playback functionality for troubleshooting and result inspection.
- Phase animations can now be exported, making dynamic acoustic results easier to present and share.
Export phase animations
Phase-based animations created from Scan&Paint 3D measurement data can now be exported for use outside VELO.
This makes it easier to communicate complex acoustic behavior dynamically, allowing changing phase relationships, sound radiation patterns, and particle-velocity behavior to be presented directly in reports, presentations, and other technical communications.
Acoustic Shape
- Compatibility with the new Trigger Box for synchronized measurement workflows.
- New Virtual Tacho functionality for rotational analysis.
- New RPM spectrogram visualization for investigating acoustic behavior as a function of rotational speed.
Rotational analysis with Virtual Tacho
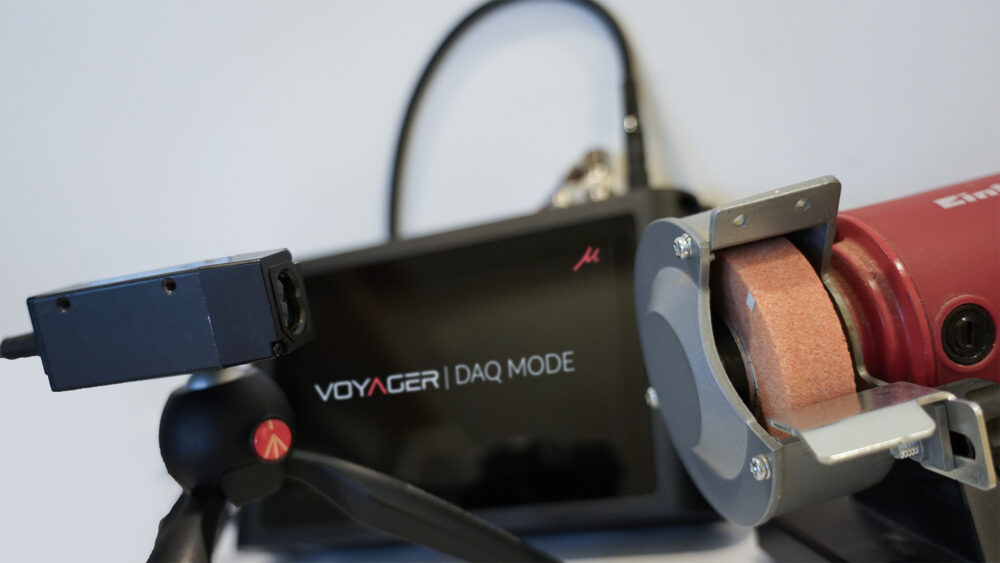
Acoustic Shape expands its capabilities for rotating machinery with a new Virtual Tacho workflow. Rotational information can be derived and used to analyze acoustic behavior in relation to machine speed, while the new RPM spectrogram provides a clear representation of how spectral components develop across the operating range. Together, these tools provide additional insight into speed-dependent acoustic phenomena without separating rotational and acoustic analysis into different workflows.
ANALYZER
- New sound power analysis process.
- New psychoacoustic calculations including loudness, sharpness and roughness.
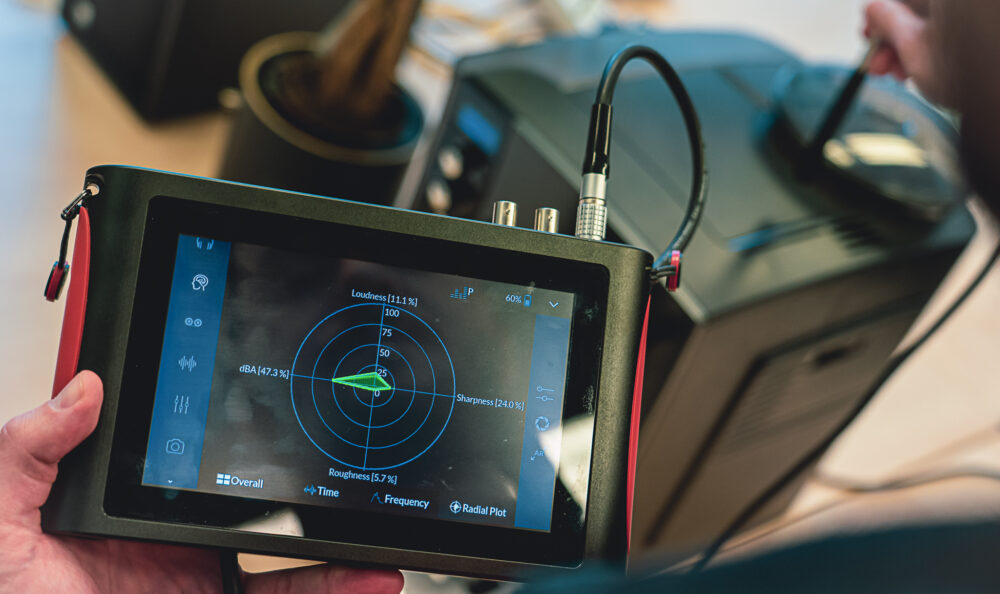
Psychoacoustic analysis
Recordings made with Voyager can now be loaded into Analyzer and evaluated afterwards, allowing users to extract psychoacoustic metrics such as loudness, sharpness and roughness directly from recorded data. This makes it easier to compare products, operating conditions or design changes using both conventional spectral results and parameters related to how the sound is perceived.
 Acoustic Testing & Analysis Software
 Scan&Paint 2D
 Scan&Paint 3D
 Acoustic Shape
 In-situ Sound Absorption testing
 Robotic Acoustic Scanner
 VELO Analyzer – Acoustic Signal Analysis Software