

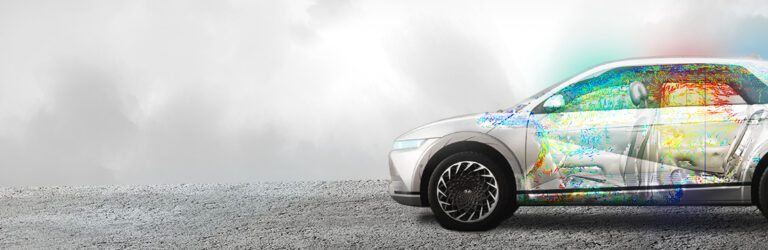
Acoustic performance enhancement of a Hyundai electric vehicle interior
The vibro-acoustic properties of a car cabin play a key role in the perception of vehicle quality. One of the main NVH goals of most car manufacturers is to enhance acoustic performance while meeting demanding weight and cost targets. Traditional applied experimental techniques have strong limitations, especially testing a complete vehicle is mostly unfeasible, requiring an independent evaluation of each subsystem.
Extracted from: E. Güven, D. Fernandez Comesaña, and T. Marini Storani, "Sound intensity-based panel noise contribution analysis for improving the acoustic performance of a vehicle interior", in Proceedings of Aachen Acoustic Colloquium, pp. 205-213, 2021.
Hyundai
In this case study, a novel methodology has been successfully applied to identify key radiation areas and rank their importance towards the position of front and rear passengers. An extension of the substitution monopole technique has been introduced, combining Microflown 3D sound intensity measurements and acoustic transfer functions. This measurement approach significantly simplifies the refinement process of a vehicle interior, reducing the traditional testing process to just a few days. The experimental results demonstrated that the proposed technique provides an extensive amount of vibro-acoustic data for every vehicle section, including noise ranking and visualization of complex acoustic phenomena in three-dimensional space.





STAY UPDATED WITH THE LATEST SOUND AND VIBRATION RESEARCH
Subscribe to our Newsletter
Goal & requirements
Apply a novel methodology to enhance acoustic performance while meeting demanding weight and cost targets.
- Complete vehicle 3D scanning and broadband, high spatial resolution sound field mapping
- Noise ranking of vehicles sections, so called panel contributions
- Design and improve the acoustic package of a commercial electric vehicle
Method
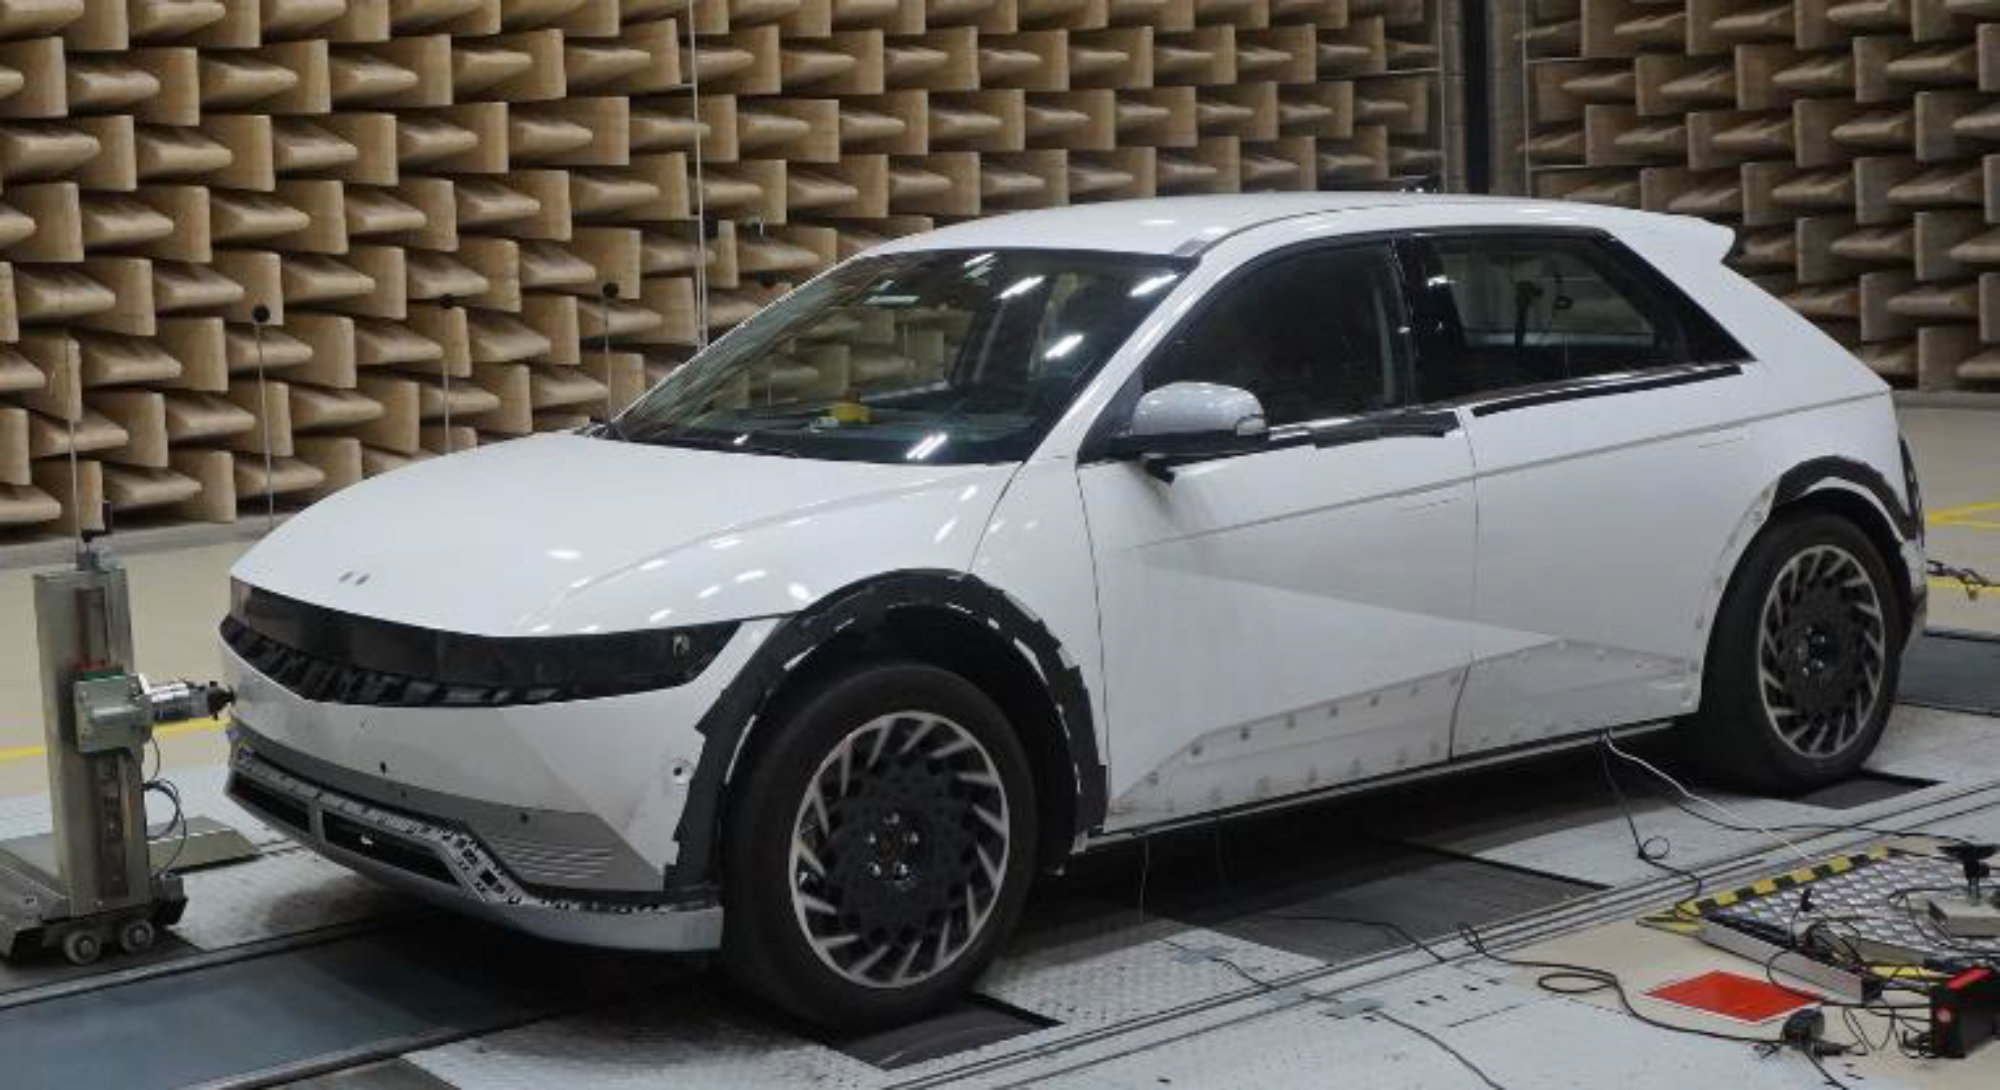
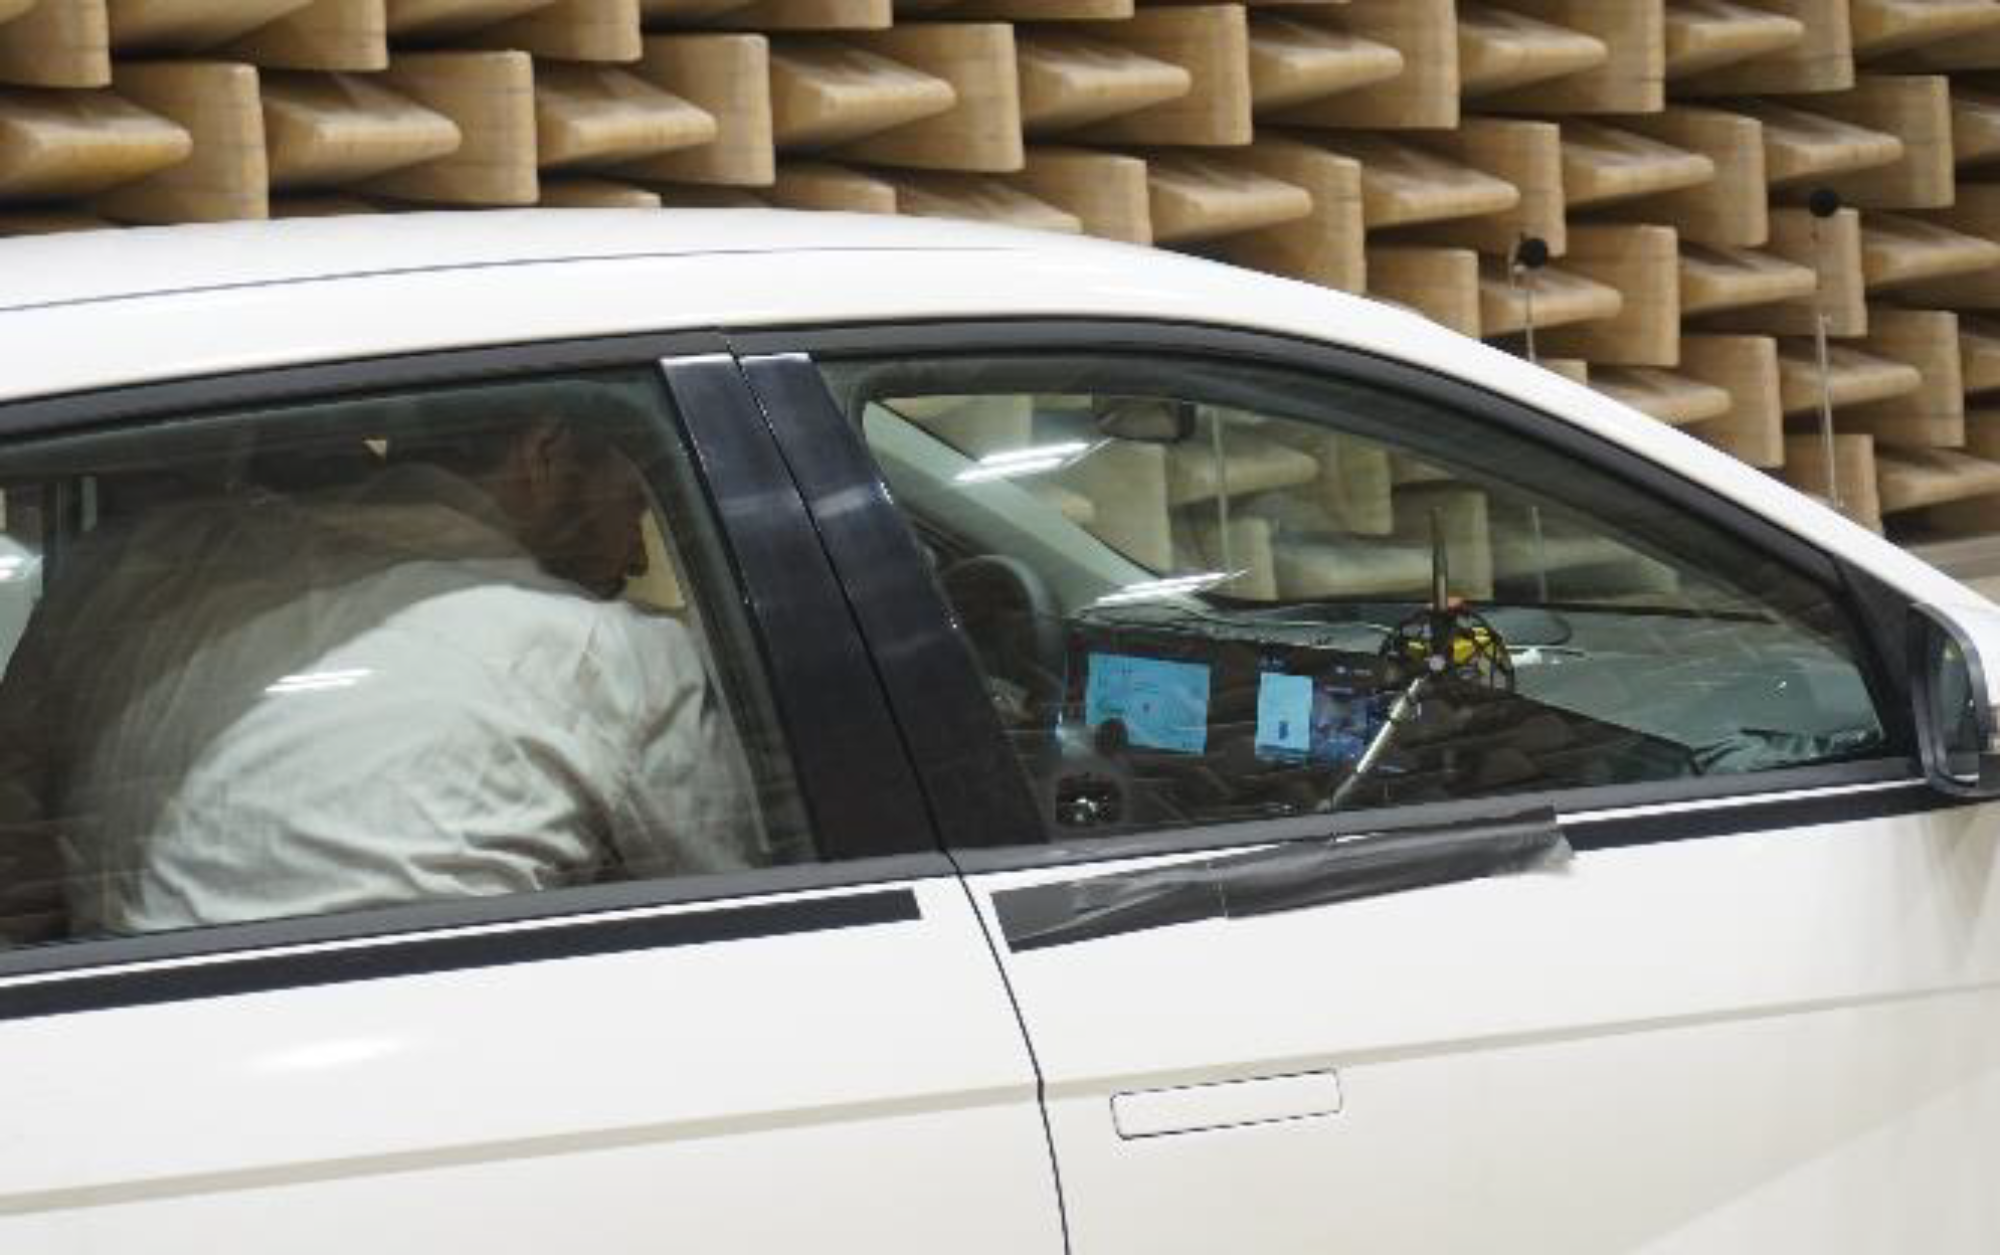
There were two types of measurements performed in this campaign; operational experiments and transfer function measurements. Operational experiments to evaluate the noise produced by an electric car, were carried out while running on a dyno inside a semi-anechoic chamber at 80 KPH and 100 KPH. Scan&Paint 3D enabled to perform a complete 3D scan of a Hyundai electric vehicle interior and measure the acoustic radiation of panels. Secondly, in non-operating conditions, volume velocity sources enabled reciprocal measurements of the acoustic transfer functions.

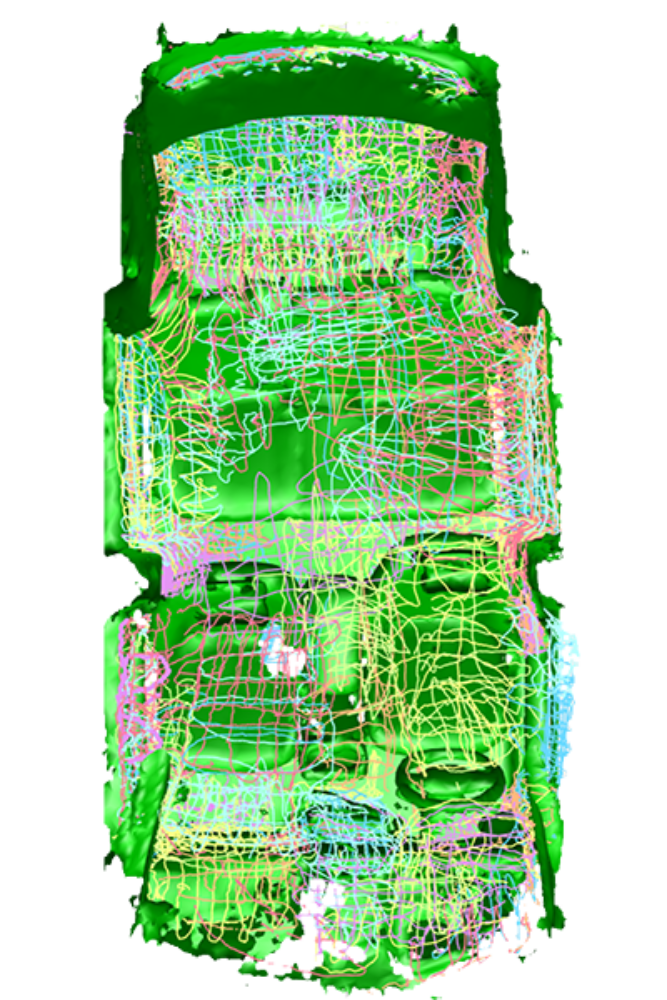
A 3D model of the vehicle is needed to link the position data with acoustic data and to create a visual representation of the sound field. The required 3D model can be imported from an existing file or obtained by scanning the area(s) of interest with a structural scanner. In this case the structural scanner was used to scan the entire vehicle interior to obtain fast & easy a 3D model.
In order to capture the complete vehicle interior and obtain a high spatial resolution, the engineer performed sound intensity measurements from multiple camera positions. Once the camera is in a position, the acoustic data acquisition process starts by manually moving a 3D sound intensity probe while a stereo camera is used to extract the instantaneous position of the sensor in the 3D space. The recorded data were segmented using a 15 mm spatial resolution grid, yielding more than 16000 data points per measured condition.

Secondly, in non-operating conditions, volume velocity sources allow reciprocal measurements of acoustic transfer functions. Two types of Microflown Volume Velocity Sources, the Low Frequency, and Mid-High Frequency VVS are needed to cover a broadband frequency range. The acoustic transfer functions enable obtaining the source-path-contribution to every discrete point location of each pre-determined panel.

OUTCOME
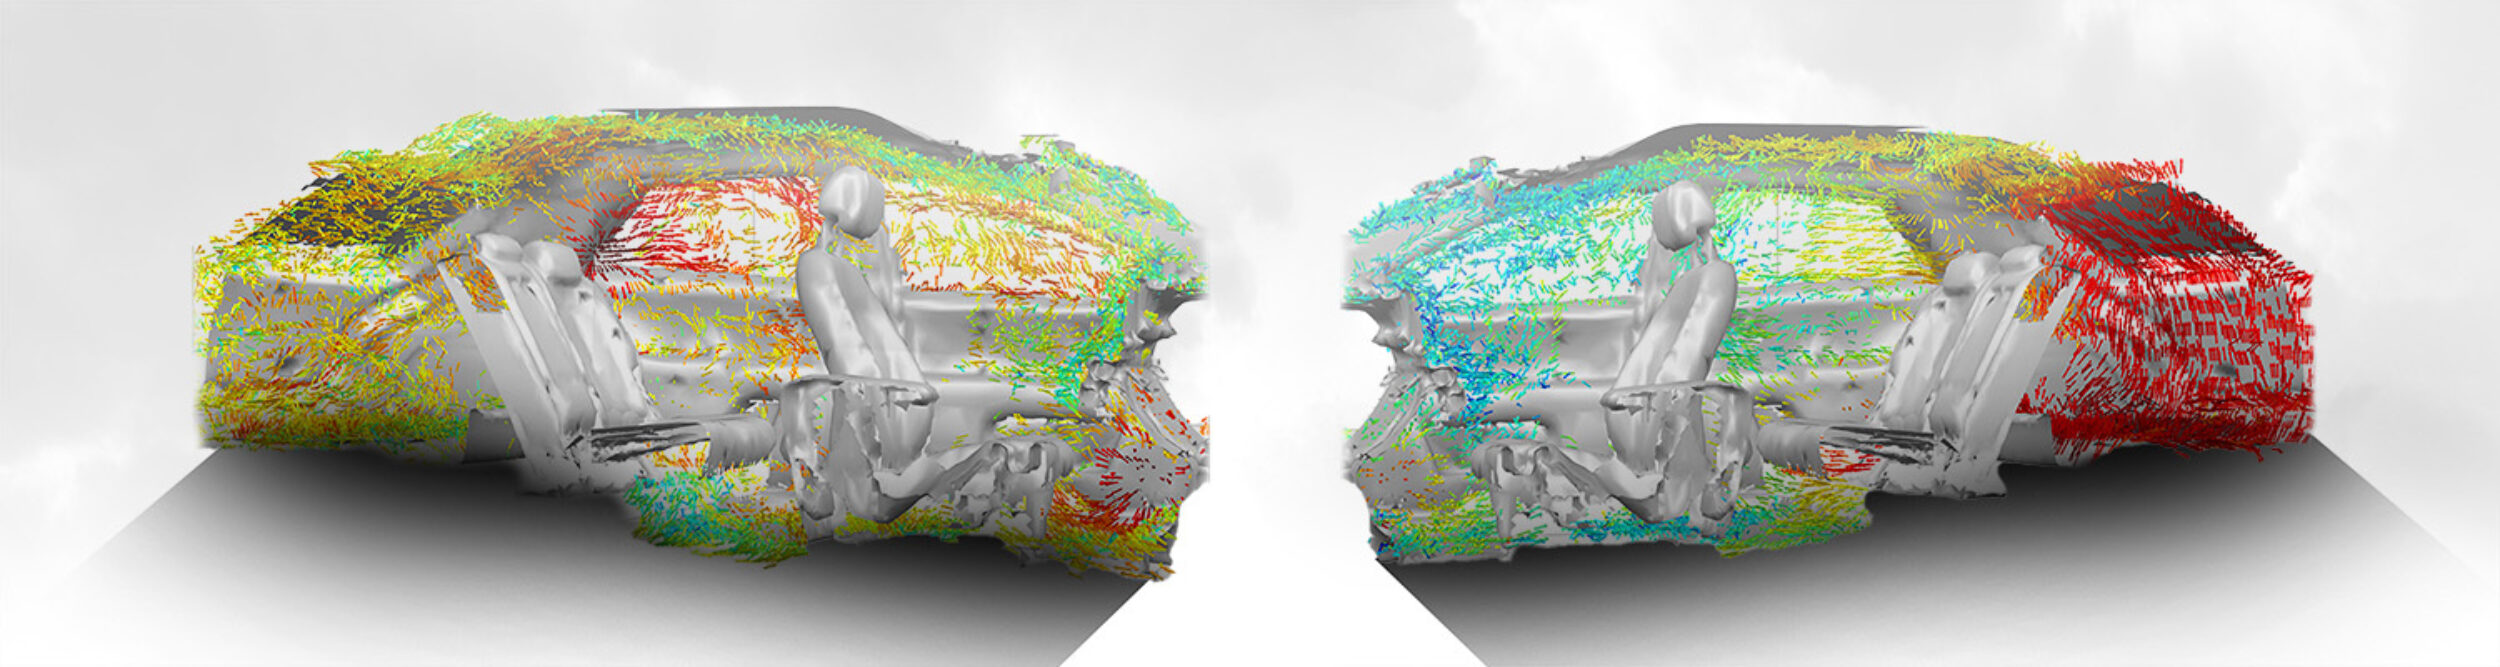
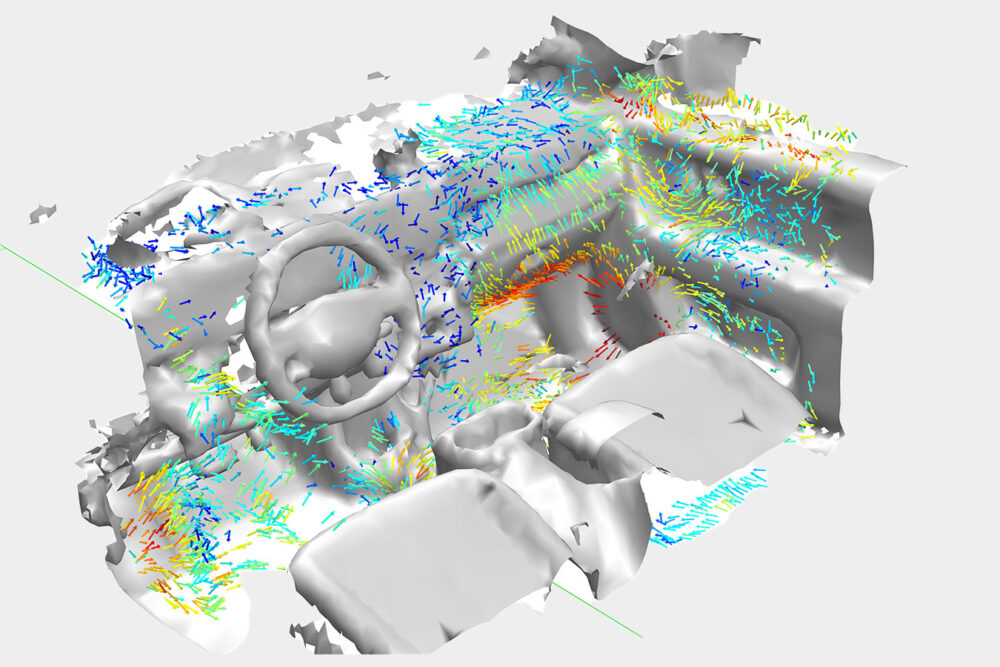
The visualization of sound intensity in a 3D space enables to get an intuitive and comprehensive understanding of sound radiation mechanisms as well as the interaction between problematic elements. By 3D scanning, it was already possible to identify two critical bands with very different behavior. The trunk has the highest acoustic emission for lower frequencies, whereas the C pillar, B pillar, and rear passenger windows seem to dominate the medium frequency range.
Secondly, a ranking of the main sections of the car interior was presented, showing that the combination of reciprocally measured acoustic transfer functions with 3D sound intensity measurements can reveal the main problematic areas for multiple operational conditions and/or frequency bands. This information was used to apply an effective acoustic treatment in order to reduce the noise perceived by the vehicle's passengers.
Introduction of a novel technique
- Easy identification of the problematic area in terms of noise emission
- Broadband, high spatial resolution visualization of the sound field to intuitively identity main sources
- Significantly decrease of required time to obtain results compared to traditional techniques
- Ranking of the panels based on their sound pressure contribution to a defined reference position
- Knowledge and information over the perceived noise by the vehicle's passenger for applying proper and effective damping treatment
 Scan&Paint 3D
 Mid-High Frequency VVS
 Low frequency VVS