


Acoustic Characterization of an Energy Storage System
This case study examines the acoustic performance of a large mobile energy storage system (3 × 2.5 × 2.6 m) under various load conditions, focusing on both the internal components and the enclosure. Through in-situ measurements and advanced visualization tools, key noise sources such as fans, transformers, other components, and enclosure leakages were identified. The analysis also revealed unexpected acoustic leakage related to structural panel modes, providing targeted insights for design improvements. Despite challenging weather conditions, the campaign was successfully carried out thanks to a flexible and adaptive on-site setup.
STAY UPDATED WITH THE LATEST SOUND AND VIBRATION RESEARCH
Subscribe to our Newsletter
In collaboration with Alfen
Alfen, a leading Dutch company, specializes in three key areas: Smart Grid Solutions, EV Charging Equipment, and Energy Storage Systems. Their systems provide a sustainable alternative to diesel generators, designed to deliver power in areas with limited grid access. A critical selling point of this technology is its low noise emission, making it well-suited for noise-sensitive environments, including nighttime operations in residential areas. To gain a deeper understanding of the acoustic performance, Alfen partnered with Microflown Technologies to carry out a thorough experimental campaign.







Measurement Objectives
The main objectives of the acoustic assessment were to:
- Identify and localize the dominant noise sources within the device and its enclosure.
- Quantify and rank the sound emissions of individual components under different operational conditions.
Measurement Setup
The acoustic measurements were conducted over two days at Alfen’s facility in Almere, the Netherlands. The approach included:
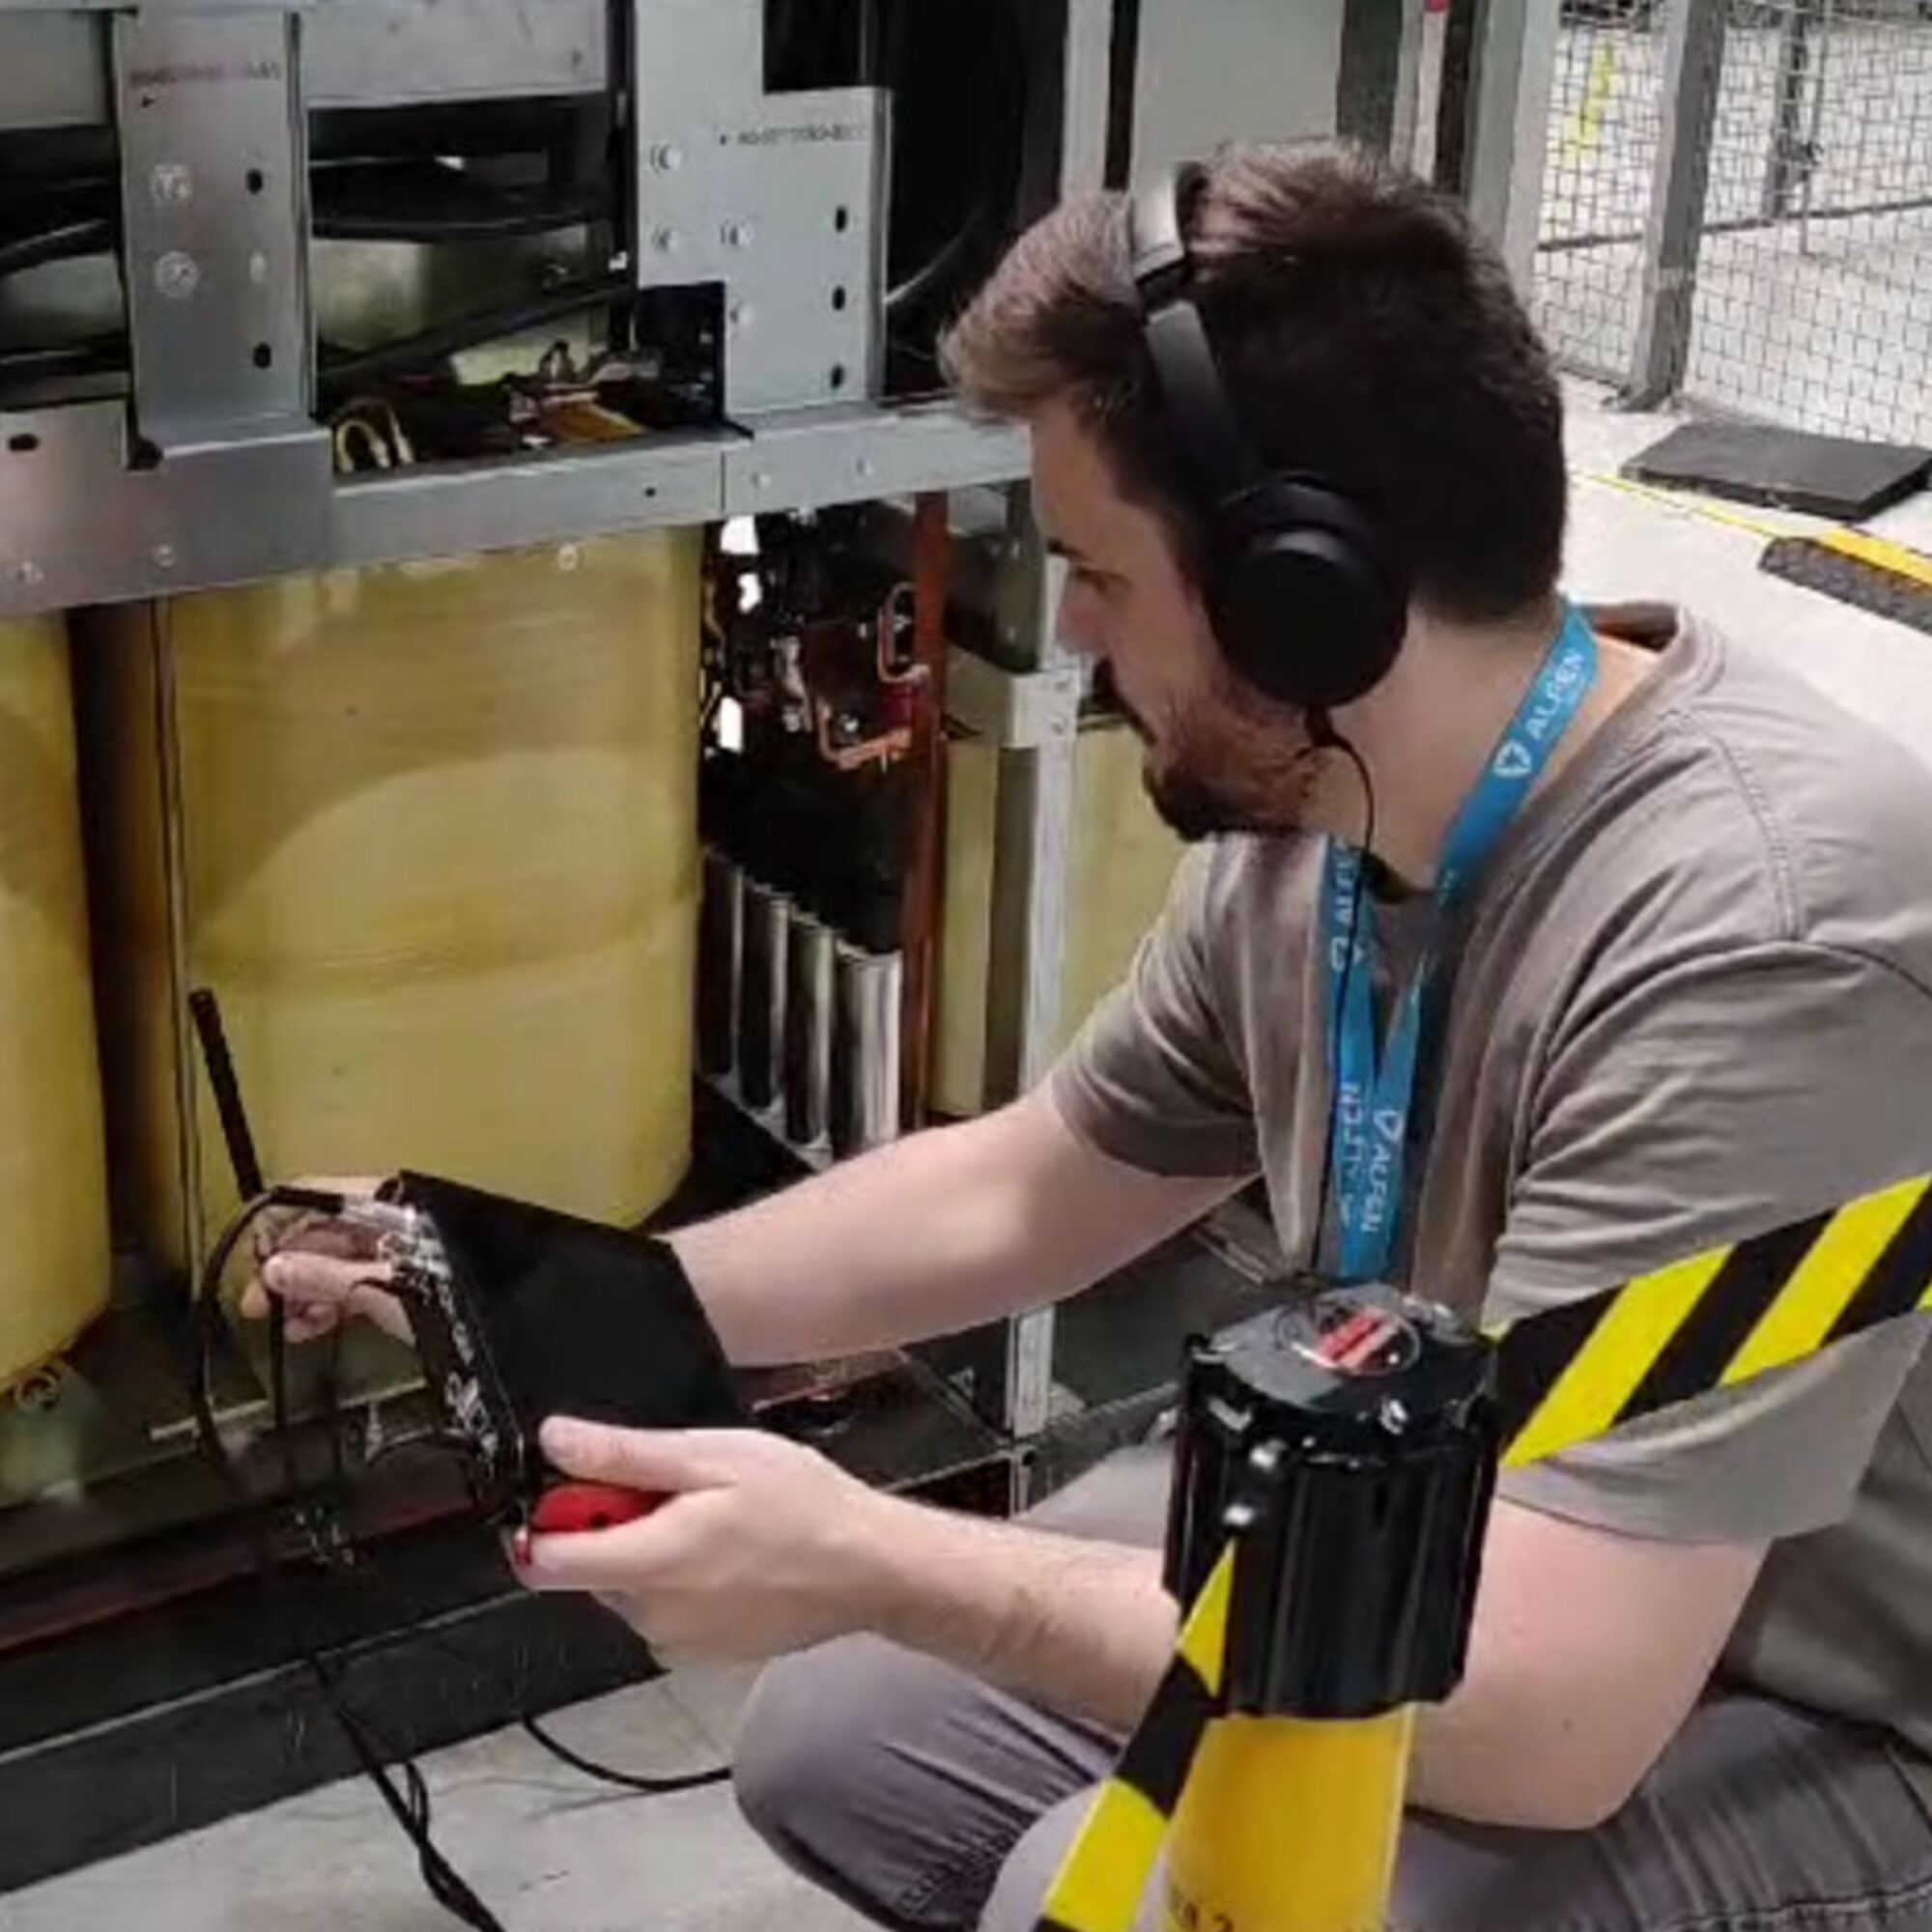
- Preliminary Scanning: Utilizing the Voyager system to perform initial scans and identify general noise hotspots.
- 3D Acoustic Imaging: Applying the Scan&Paint 3D system to capture detailed acoustic data of the device skid (the core system without its enclosure).
- 2D Acoustic Imaging: Using the Scan&Paint 2D system to evaluate the fully assembled mobile energy storage container.
Multiple measurements were carried out under different power load scenarios, with varying fan speeds, to represent the most relevant operating conditions. The device skid was tested indoors in a general-purpose workshop, while the fully assembled system was measured outdoors inside a pop-up tent, minimizing disturbance from UV light and rain.
Noise Source Identification via 3D Acoustic Mapping
With 3D sound intensity visualization, we tracked how noise emissions evolved across different frequency bands and power conditions. In all scenarios, one component consistently stood out as the dominant source, while other subsystems contributed at specific frequencies or loads. Importantly, the spatial mapping also revealed less intuitive behaviors, such as localized increases in radiation at certain power levels and distinct tonal components in higher frequency bands. These insights, visible only through 3D visualization, provide precise diagnostics that extend well beyond traditional acoustic color maps.
Component-Level Sound Power Ranking
By segmenting the full system into individual panels, we quantified how different components contribute to the total sound power under various operational states. The analysis showed that one element dominates most of the frequency range, acting as the primary noise contributor. In the higher frequency bands, however, other components became more prominent, generating distinct spectral peaks. This panel-based decomposition highlights the acoustic footprint of each component, enabling targeted design improvements and more efficient mitigation strategies.


Structural Modes and Panel Radiation
After characterizing the system’s core, the fully enclosed device was tested outdoors using 2D sound mapping. A key acoustic challenge in compact enclosures is the interaction between structural panel modes and acoustic leakage, particularly in the low-frequency range. In this case, below 150 Hz, velocity mapping revealed significant leakage at the bottom junction of the battery door, combined with structural resonance modes in the door panels. By visualizing these effects, we were able to pinpoint where structural reinforcement, improved sealing, and enhanced damping would deliver the greatest impact.
Conclusion
This investigation successfully demonstrated the value of in-situ acoustic measurements using advanced particle velocity, based tools in both 2D and full 3D. The insights gained not only supported the validation of low-noise product targets but also provided actionable data to further enhance the acoustic performance of the energy storage system. This case highlights the value of real-time, on-site acoustic visualization, not just for data collection, but for reshaping understanding and enabling more effective steps toward reducing overall noise emissions.
 Scan&Paint 3D
 Voyager
 Scan&Paint 2D