


The Evolution of Sound Visualization: Historical Perspective
The necessity to represent sound and vibration information visually triggered many investigations with a common goal: to create tools to build intuition and understanding of specific problems. To understand the current state of the art of acoustic imaging systems, it is worth highlighting the importance of developing devices for displaying sound phenomena, and how it has evolved thus far. This will allow us to understand the value of the proposed method within the current state of the art and previous techniques.
In this blog, we embark on a journey through the annals of history, charting the evolution of innovative acoustic methods and apparatus. We delve into pioneering experiments on sound and vibration imaging from the 18th and 19th centuries. Following this, we assess the advancements made in visualizing sound propagation phenomena. Concluding this historical overview, we outline the principal acoustic measurement techniques that have been unveiled over the past century.
STAY UPDATED WITH THE LATEST SOUND AND VIBRATION RESEARCH
Subscribe to our Newsletter

Early sound and vibration imaging, before acoustic cameras
Although the interest in acoustics is considered to have its origins in ancient Greece with studies concerning vibrating strings and musical sounds were undertaken by Pythagoras, it was not until 1787 when the first technique for visualizing vibration in plates was introduced. Ernst Chladni, based on the previous work of Robert Hooke and Simeon Poisson, introduced his method of using sand sprinkled on vibrating plates to show modal lines. He generated the so called by strewing sand on a vibrating plate excited with a violin bow, causing the sand to collect along the nodal lines.
Napoleon sponsoring sound and vibration research
Interest in Chladni's success went beyond the scientific community of his time, amusing even Napoleon Bonaparte, who ordered a translation of his major work "Die Akustik" into French and offered a reward to whomever would be able to explain the "Chladni patterns" mathematically. With Fourier's wave theory in its infancy, the necessary theoretical framework to address the challenge was still under development. Esteemed scholars like Lagrange and Laplace believed the mystery was too complex to unravel at the time. Sophie Germain was awarded the prize offered by the French emperor Napoleon for writing a fourth-order equation to describe plate vibrations. Despite this achievement, she couldn't attend the Academy's sessions as a woman. It took another two years and the intervention of her friend, Joseph Fourier, to secure her a seat in the Academy.
Acoustic apparatus of the 19th century
During the 19th century, several acoustic apparatus were designed to measure and visualize sound phenomena. In 1827, Sir Charles Wheatstone coined the term microphone which was initially associated with a purely acoustical device, similar to a stethoscope; nonetheless, his most successful invention was the kaleidophone. Although his apparatus helped him to understand that the modal behavior of a structure is linked to the superposition of transversal waves, the kaleidophone only provided a visual demonstration of the complex motion of a vibrating body.
Around forty years later, Hermann von Helmholtz invented a vibration microscope for sound and vibration visualisation of violin strings and human speech. The device reveals the frequency of a tuning fork or other vibrating object with respect to a fork of known frequency by way of Lissajous figure analysis. By viewing the patterns for a bowed violin string, von Helmholtz was able to determine the actual motion of the string, which is still referred to nowadays as the Helmholtz motion. A picture of the device is shown along with some examples of Lissajous patterns.

In 1866, closely related to von Helmholtz' work, the German scientist August Kundt first proposed a way of visualizing standing acoustic waves, ultimately allowing him to measure the speed of sound in different gasses. He used seeds of lycopodium and corkdust to show periodic patterns when standing waves were created in the tube. Similar work was developed in England by John Tyndall, who created several apparatus to illustrate sound phenomena; for instance, he made use of ripples for the demonstration of wave phenomena in connection with the propagation of light. As we shall see, his experiments established a starting point for novel sound visualization techniques based in wave propagation on water developed during the next century.

The use of burning gases for sound visualization purposes was explored in detail by the Russian scientist Rudolph Koenig, who devoted more than 40 years to creating a large collection of innovative acoustical equipment. His most famous contribution, the manometric flame, allowed him to study the nature of all kind of acoustic signals in a visual way. The manometric capsule is divided into two parts by a thin flexible membrane.
Sound waves are collected by a funnel and cause the membrane to vibrate. The oscillations cause a periodic change in the supply of gas to a burner, so the flame moves up and down at the frequency of the sound. A rotating mirror allows one to view the flame variations caused by the sound. By incorporating Helmholtz resonators it was even possible to use this apparatus as a Fourier analyser, expanding its capabilities for a wide range of applications.

Visualisation of wave propagation
At the beginning of the 19th century, in optics literature, it was pointed out that it was impossible to accomplish a stroboscopic observation of an expanding spherical wave. Nevertheless, August Toepler between 1859 and 1964 realized that a probing wave of pulsed light is able to freeze an expanding spherical sound wave, since the velocity ratios are about one million to one. Thus, he invented a technique to see traveling waves: the Schlieren method. The Schlieren method entails "amplifying" small differences in the optical refraction index of the medium through which the sound wave travels. This amplification therefore increases the contrast between transparent objects having extraordinarily small index differences.
The impressive results obtained by Toepler encouraged other scientists to research this area and also expand upon the method for other fields of science. The Dutch scientist Friest Zernike presented a new perspective of the Schlieren method which won him a Nobel Prize in 1953. The conventional Schlieren methods were applied from a geometrical-optics point of view and, in contrast, he analyzed the method with a wave-optics point of view. He improved the method but constrained to microscopy, introducing the phase contrast microscope. A remarkable example of a prolific career linked to Schlieren imaging is that of Ernst Mach. During his early life, Mach enhanced the initial device of Toepler to achieve a synchronized delay circuit for visualizing "sound" waves from sparks. The combination of his developments with the latest technology of photographic film enabled precise wave-speed measurements. His findings ultimately led him to discover that the waves from sparks were not mere sound waves, they were "supersonic". Unfortunately for Toepler, he did not live long enough to become aware of Mach's discoveries and on his epitaph still remains the misleading sentence "He was the first to see sound," referring to his Schlieren images of weak shock waves.
Another remarkable optic-based sound visualization method was created by one of Mach's assistants, Vincenz Dvorak, who published the first traditionally-recognized account of the simplest sound observation method in 1880, the so-called shadowgraph technique. Dvorak used sunlight focused on a 1 mm aperture to project a diverging light beam across his darkened lab onto a white wall. As a result, refractive phenomena in the middle of the beam appeared as shadows on the wall. There are remarkable similarities between previous research done by Robert Hooke throughout the 17th century and Marat's forgotten ``helioscope'' shadowgraph apparatus introduced in 1780. The lack of popularity of both works left only recognition for Dvorak's ``novel'' device.
Some decades later, in 1912, Foley and Souder reinvented the Dvorak's shadow method as a new alternative to Schlieren devices. Surprisingly, Foley and Souder referenced the previous devices of Toepler and Mach, but did not mention anything about Dvorak's work. They created a device that generates a shock wave from an electric spark followed by a light flash.


Shadowgraph techniques were extensively used by many scientists throughout history such as W. C. Sabine (1868 -1919). He built models of concert halls, fired sparks, and sent weak shock waves reverberating around them. These weak shocks, almost sound waves, revealed themselves in direct shadowgraphs, allowing for the study of the emitted waves at different stages in their propagation through the room.
Sabine brought forth the first real understanding of sound in auditoriums at the beginning of the 20th century, for which he is nowadays considered the father of modern architectural acoustics.
In addition, shadowgraphy was also used as a key aid to study the analogy between cylindrical sound waves and waves on the surface of a liquid. Ripples in a small tank are suitable for illustrating acoustical phenomena when the wavelength is comparable to the size of any objects used. Although the potential for using a water tank to study sound propagation inside enclosures was already discussed in 1844, and later demonstrated by Tyndall, it would not be until 1925 when extensive research was undertaken by A. Davis. His work established the limitations of the use of water tanks to study sound propagation phenomena. As can be seen, even though the use of the optic-based technique results in clearer images, the similarities between the two experiments show the possibility of using wave propagation in water as a simple alternative technique to study sound

Early acoustic visualization methods of the 20th century
The beginning of the 20th century brought the first effective attempts to introduce modern and precise measuring instruments into the field of acoustics, primarily by Arnold and Crandall of the American Telephone and Telegraph and Wente from Western Electric Laboratories. Unfortunately, World War I and II caused large changes to the trends of scientific production; sound visualization was no longer a primary goal. A large number of government-sponsored laboratories were formed in addition to already existing industrial groups focused on communication and military purposes. This new trend caused worry in the scientific community, as was recorded for instance by Eccles in 1928, who stated: "New acoustics is Baconian, that is to say, it is being prosecuted with a view to rendering services to mankind rather than from the motive of scientific curiosity".


Scan-based sound visualisation methods
It was not until the 1960s that new methods for sound visualization were introduced. The first scanning technique to display sound was presented by Winston Kock in 1965. He worked extensively on improving his apparatus which led him to later publish the book "Seeing sound". Kock's method was not directly based upon visual observation like Toepler's technique but rather indirect visual observation. The electrical signal of the microphone can be made visible by causing it to light an electric neon bulb. The brightness of the lamp at a particular spot is then indicative of the loudness of sound at that point. In order to photographically record the brightness pattern, he set a camera with a long time exposure aimed at the area of interest. Consequently, as the microphone-light device scans the area with a fixed speed, the camera records the light intensity variations from point to point. In addition, he also developed a subtraction technique for visualizing the wave patterns across a sound field. The addition of the microphone signal with the excitation signal results in a coherent summation of both waves. This reinforces the light output when the two signals are in phase, whereas the brightness is very low when they have opposite phases.
Cymatics
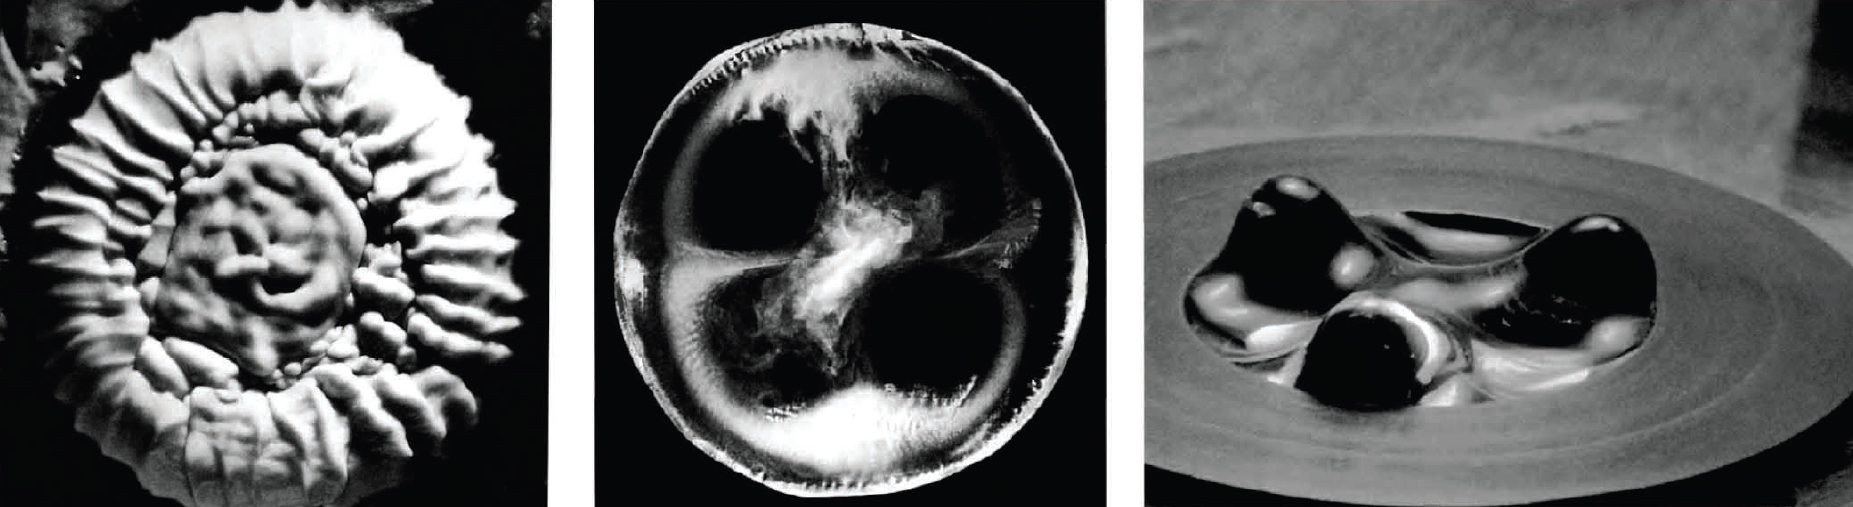
Completely independent of Kock's work, Hans Jenny attempted to redefine the study of visible sound and vibration during the 60s with the term "cymatics". Inspired by the work of Ernst Chladni, he delved deeper into the many types of periodic vibro-acoustic phenomena in a similar fashion to Chladni. He tested the vibrating surface of plates, diaphragms and membranes by applying a thin coating of particles, paste, and liquids. Those materials reorganize depending on the level of vibration across different areas, therefore displaying different patterns. His holistic approach to science, his claims of the ability to "bring matter to life with sound" and his fascination for occultism, divided opinions between those affirming his responsibility for the "history of bad acoustics" and those who believe that his patterns hide something beyond science, something that could lead to the understanding of the healing power of audible sound. The credibility of the second group is undoubtedly questionable, and it is a shame that the supporters of the hidden power of sound can argue that their beliefs are based upon "scientific work".
Holographic interferometry
Another alternative measurement technique which emerged during the same period is holographic interferometry. In the 40s, Dennis Gabor presented a technique that allowed the recording of both amplitude and phase information of a wavefront at any point in space. With this technique, which Gabor named holography (from the Greek holos, or the whole), it was possible to reconstruct, from one hologram measurement plane, the complete field generated. But it was not until the 60s when some independent works revealed that this technique could be very useful for experimental mechanics applications if interferometry between holograms were used to detect phenomena that can be encoded in a wave front. One of the earliest practical studies investigated using holographic interferometry use this technology to produce visualizations of the vibrating behavior of a violin body.

Acoustic Cameras
In the 1970s, multichannel microphone arrays were first applied to sound source localization, although the concept dates back to World War I. The first microphone antenna, or "acoustic telescope," was invented by Billingsley in 1974. Since then, the use of multichannel products has grown substantially with improvements in data acquisition systems, computing hardware, and localization algorithms. Since 1999, devices known as "acoustic cameras" have been marketed as solutions for detecting and localizing noise sources in a sound field.
Concluding remarks
Throughout history, the field of acoustics has seen a persistent drive to better understand sound and vibration. By not just hearing, but visually representing sound, we've opened up new avenues of exploration. Many prolific scientists have harnessed these sound imaging techniques as key tools in their illustrious careers. These pioneers used sound visualization as a catalyst, propelling their research and innovations. Their successes remind us of the importance and potential of this approach, reaffirming the power of visualizing sound in shaping the future of acoustics.
This text was extract from Chapter 2 of the PhD Thesis entitled "Scan-based sound visualization methods using sound pressure and particle velocity". All the reference to the original sources can be found in the linked full text.
 Sound Source Localization