


Scan&Paint 2D
-
Sound Intensity Probes
-
Particle Velocity Sensors
-
Sound Sources | VVS
-
Portable Measurement Devices
-
Sound Source Localization
-
Acoustic Material Testing
-
Sound Power & Source Ranking
-
End of Line testing software
-
Acoustic Testing & Analysis Software
-
Sensor Arrays
-
Preamplifiers & Frontends
-
Accessories
An acoustic imaging system with unmatched spatial resolution
Our testing solution provides engineers with a powerful tool for acoustic imaging and noise source identification, achieving exceptional spatial resolution within the full acoustic bandwidth. It is designed specifically to visualize time-stationary sound fields accurately, making it an ideal choice for various engineering needs such as troubleshooting, soundproofing, and product benchmarking. With the utilization of cutting-edge PU probe sensing technology, you can efficiently conduct measurement campaigns and obtain precise acoustic imaging results. Gain valuable insights into the precise location of sound sources across low, mid, and high frequencies.



Features
- Broadband Solution: 20Hz - 14kHz
- Real-time probe position tracking
- Fast & Easy, results in minutes
- Applicable in operating environments
- Sound Power calculation
- Reference sensor for phase correlation and ODS
- Portable, single-sensor solution
- High-resolution acoustic imaging of:
- Particle velocity
- Sound intensity
- Sound pressure

- Introduction Video
- Quick guide, from setup to results
Curious About Pricing Details?
Versatile and Scalable, ready to take on any acoustic challenge
Our system has a proven track record of its versatility by being used in many different applications and markets. From small hearing aids to large gas turbines, size does not matter, Scan&Paint 2D has the answers. For over a decade, this versatile testing solution has been putting particle velocity on the (sound)map. The numerous product enhancements are making the tool more powerful than ever before!




An acoustic camera alternative using a single sound intensity probe
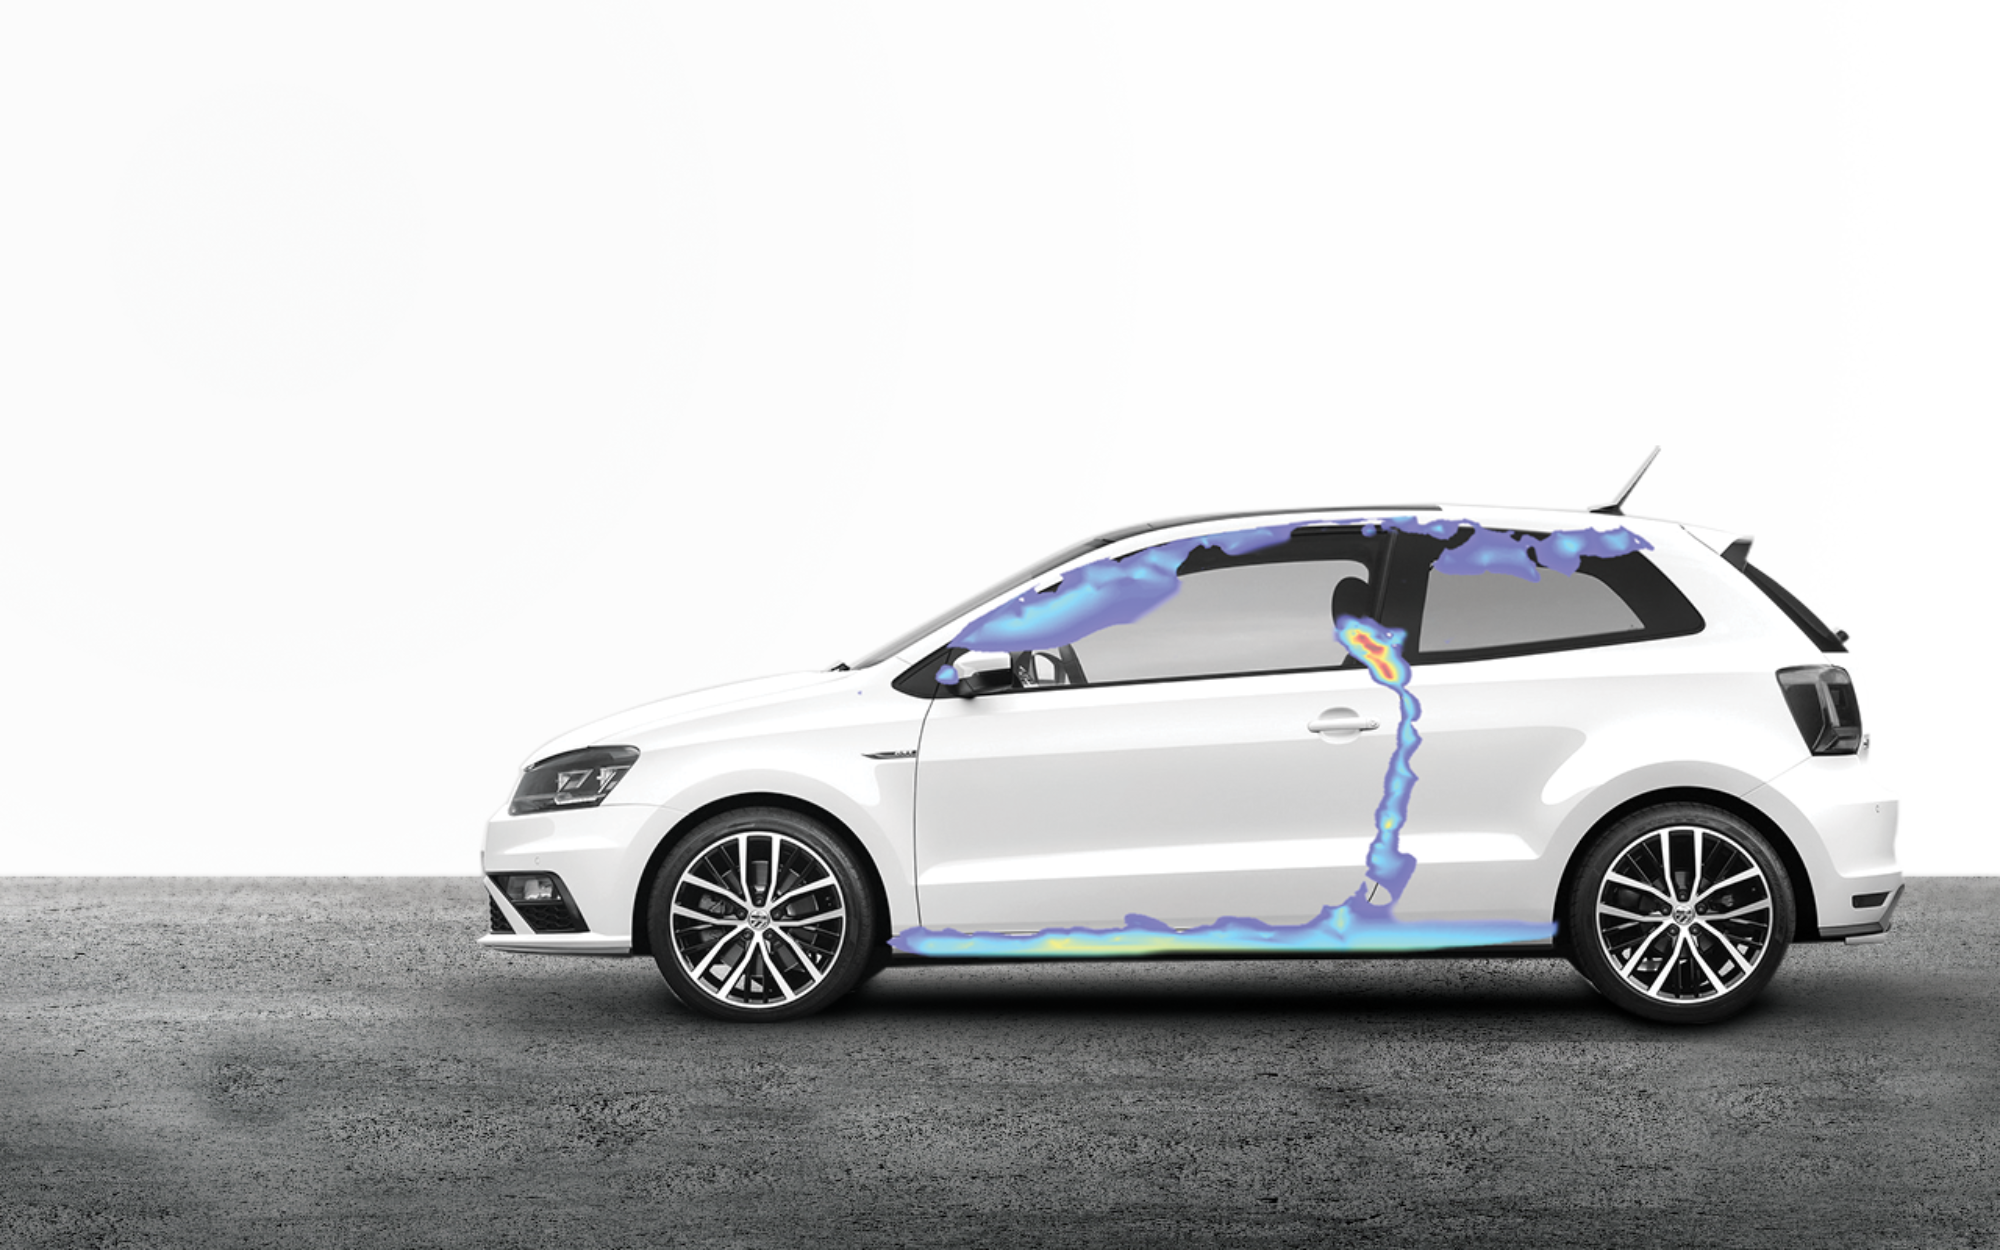
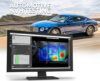
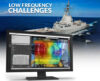
Our acoustic imaging system uses a simple and effective method for measuring time-stationary sound fields. The surface of the object being measured is scanned with a single PU probe, which is simultaneously captured by a camera. The recorded video and probe measurement data are automatically synchronized while the positions of the probe are extracted using live IR-LED tracking. This information is then used to produce acoustic imaging, which shows the origin of noise on the object. Unlike traditional acoustic camera systems, our unique probe sensing technology allows us to achieve high-resolution imaging even for low frequencies in the most challenging environments.

Real-time probe position tracking
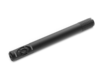
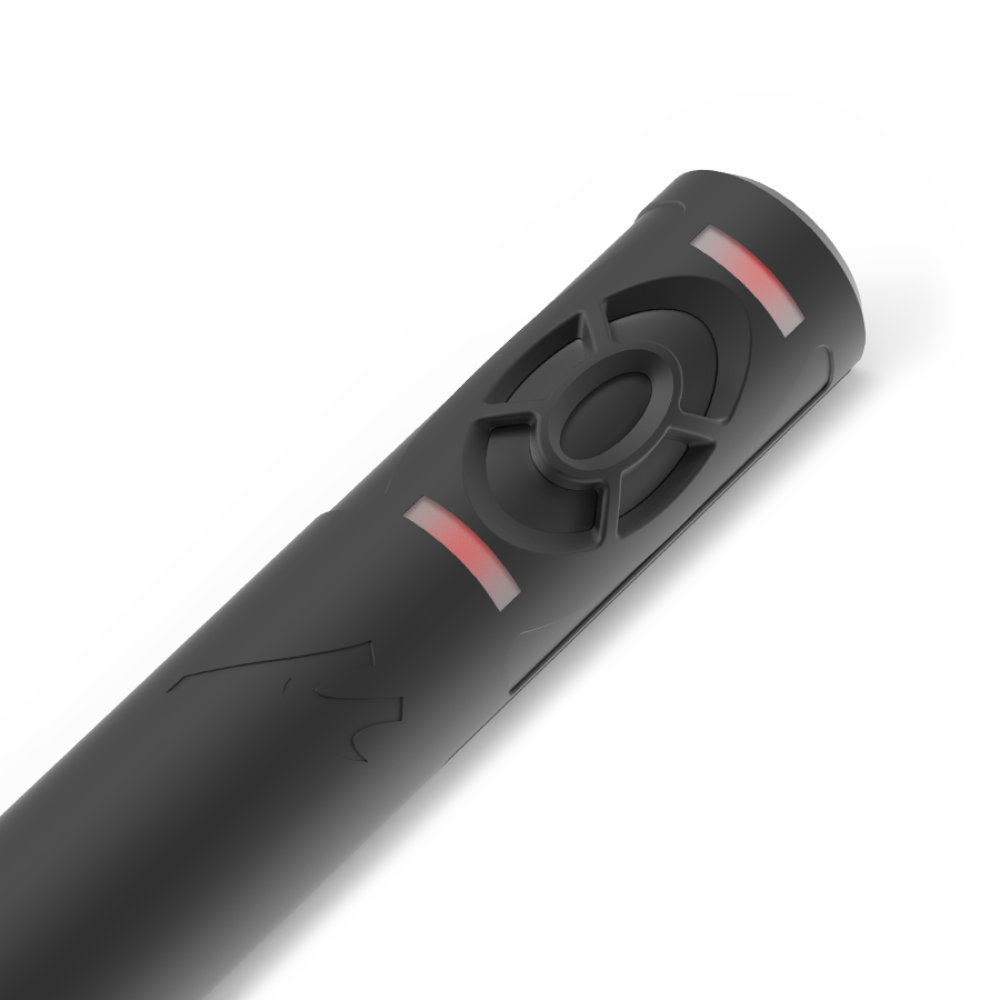
Getting you faster to your results, that's what our new real-time tracking feature offers you. Our revamped acoustic imaging system includes state-of-the-art technology: a new generation PU probe, and a revolutionary camera. The PU Regular GEN2 has two integrated IR LEDs that are invisible to the naked eye. When used in combination with our advanced camera, these LEDs enable real-time tracking of the probe's position as it moves across the surface of the object being measured. Saving you valuable time, and allowing you to convert data into sound maps with a single click.
Capturing particle velocity directly enables testing in acoustically challenging conditions, such as office spaces, workshops, or even industrial facilities. Perform sound source localization, regardless of the size of the source or its operating environment. In addition, sound intensity becomes as straightforward as it can be, simply by taking the time-averaged cross-spectrum of the two measurable quantities, the particle velocity, and the sound pressure. Sound intensity PU probes produce broad-band sound intensity results that are not affected by the p/I index, maximizing the versatility of the acoustic imaging solution. Our advanced camera's depth technology automatically connects sound intensity to dimensions, providing direct measurements of sound power. Preserve the relative phase of the measured particle velocity distribution by adding an additional reference sensor. Sound source localization, sound intensity mapping, noise ranking, sound power, or operational deflection shapes (ODS), our versatile acoustic imaging system covers it all.
- Transmission Loss Mapping
- Absorption Mapping
- Transfer Path Analysis
-
Assess how effectively a structure blocks sound, now with spatial detail
The Transmission Loss module gives engineers a practical tool to evaluate how much sound is stopped by a surface or barrier. By measuring both sides of a structure and applying spatial mapping, Scan&Paint 2D reveals how transmission loss changes across an area of interest.
This helps identify leakage paths, inconsistencies in insulation, or local weaknesses in panels, doors, casings, and other components. It’s a highly efficient workflow for material testing, enclosure design, and noise control engineering, bringing laboratory-grade insights into standard environments.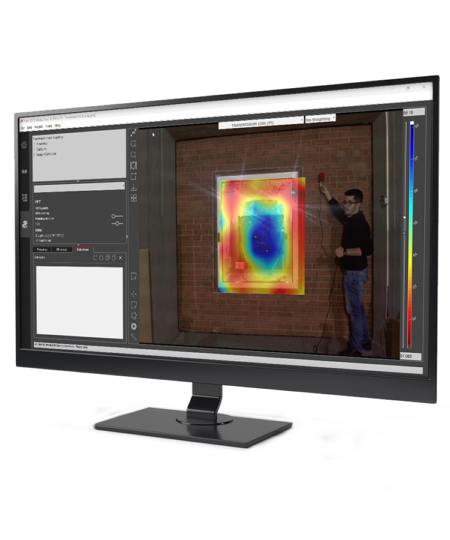
-
Visualize absorption performance directly on the surface you measure
The absorption mapping functionality in Scan&Paint 2D allows you to generate spatially resolved maps of how a surface absorbs sound. Instead of relying solely on point-based measurements, engineers can now inspect how absorption varies across panels, materials, or assembled products with a clear 2D visualization.
Whether you’re characterizing interior trim, acoustic treatments, or prototype materials, the software instantly turns your scan into a color-coded map that highlights variations and potential weak spots. It’s a fast and intuitive way to assess material behavior and supports both development and troubleshooting scenarios without requiring specialized facilities.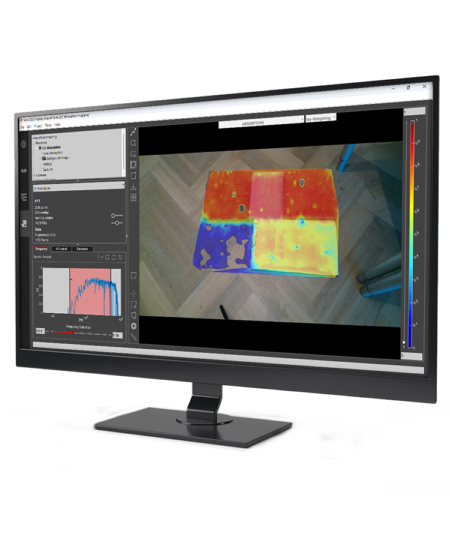
-
Quantify how individual paths contribute to the total sound field
The new Transfer Path Analysis (TPA) module introduces a streamlined workflow for determining which structural or airborne paths are responsible for noise at a receiver location. Using pressure and particle velocity measurements, Scan&Paint 2D separates the contribution of each path, enabling engineers to pinpoint dominant sources and prioritize countermeasures.
Designed for practical use in development and troubleshooting environments, the module helps reveal whether noise issues originate from panels, fasteners, openings, or specific structural elements. Engineers can quickly assess the effect of modifications and rely on graphical outputs that make contribution analysis easier to understand and report.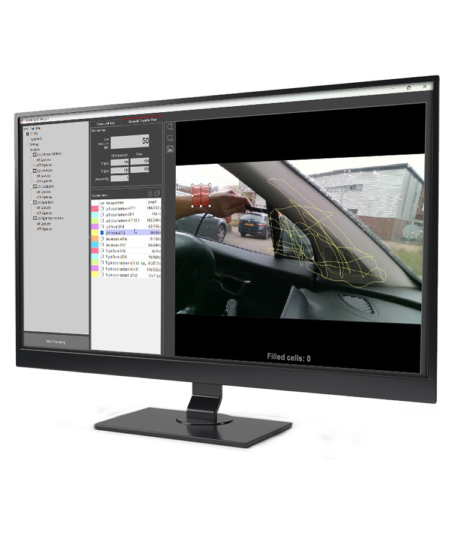
Transforming Sound Source Localization Worldwide
Sound source localization is an important topic in the field of sound & vibration, from the product development stage to the end-of-line quality control. Since 2011 at its origin in the Netherlands, Scan&Paint 2D quickly made a name worldwide. Microflown Technologies put themselves on the map, providing a solution that could do on-the-spot acoustic measurements in minutes. The solution’s versatility is shown in its use case portfolio, ranging from objects the size of a PCB to an airplane, from companies specializing in home appliances to big OEMs in the automotive industry. Over the years, this improved the acoustic footprint of many products we use daily, making the world more silent and pleasant.
Frequently asked questions
-
Particle velocity is the best indicator as velocity is less dependent on the test environment. Particle velocity has twice the spatial resolution of sound pressure, while sound intensity mapping has about 1.5 times better resolution than pressure. The SNR gets maximized in the vicinity of the noise source.
-
Frequency resolution is determined by the difference between each bin of the frequency vector. This depends on the parameters of the analyser, such as the FFT points and sampling frequency. To achieve 1 Hz resolution, simply use the same number of FFT points as the sampling frequency.
-
• 1 – 5 cm for source localisation (maximum SNR)
• 5 – 10 cm for sound intensity (low reactivity error)
• The spatial integration improves as the probe is held farther from the surface. -
• 5 – 10 cm/s
Spending more time in a cell or using a slower scanning speed results in better statistical values for lower frequencies. It also allows for more detailed processing of the results, such as using a higher FFT number or smaller grid size. -
Operating system : Windows 10 or 11
Minimum processor : 2,5 GHZ Dual Core Preferable i5 or Higher
Memory : 8Gb internal memory or higher
Graphics : Hardware accelerated graphics card supporting OpenGL 3.3 with 1GB CPU memory
USB required : 2 ports, USB type 2.0 and 3.0
 Voyager
 PU Regular GEN2
 Sound Calibrator
 Scan&Paint 3D